Contents

Exposing Kafka producer & consumer metrics to actuator


Introduction

In this blog post we’re going to explore how to expose Apache kafka's producer and consumer metrics to Spring Boots's actuator, and then importing them into prometheus and displaying them as a Grafana dashboard. Doing this will help us keep track of kafka’s producer and consumer performance and also will help us to see the impact of specific producer or consumer configuration properties.

Creating a simple Kafka producer application with spring boot

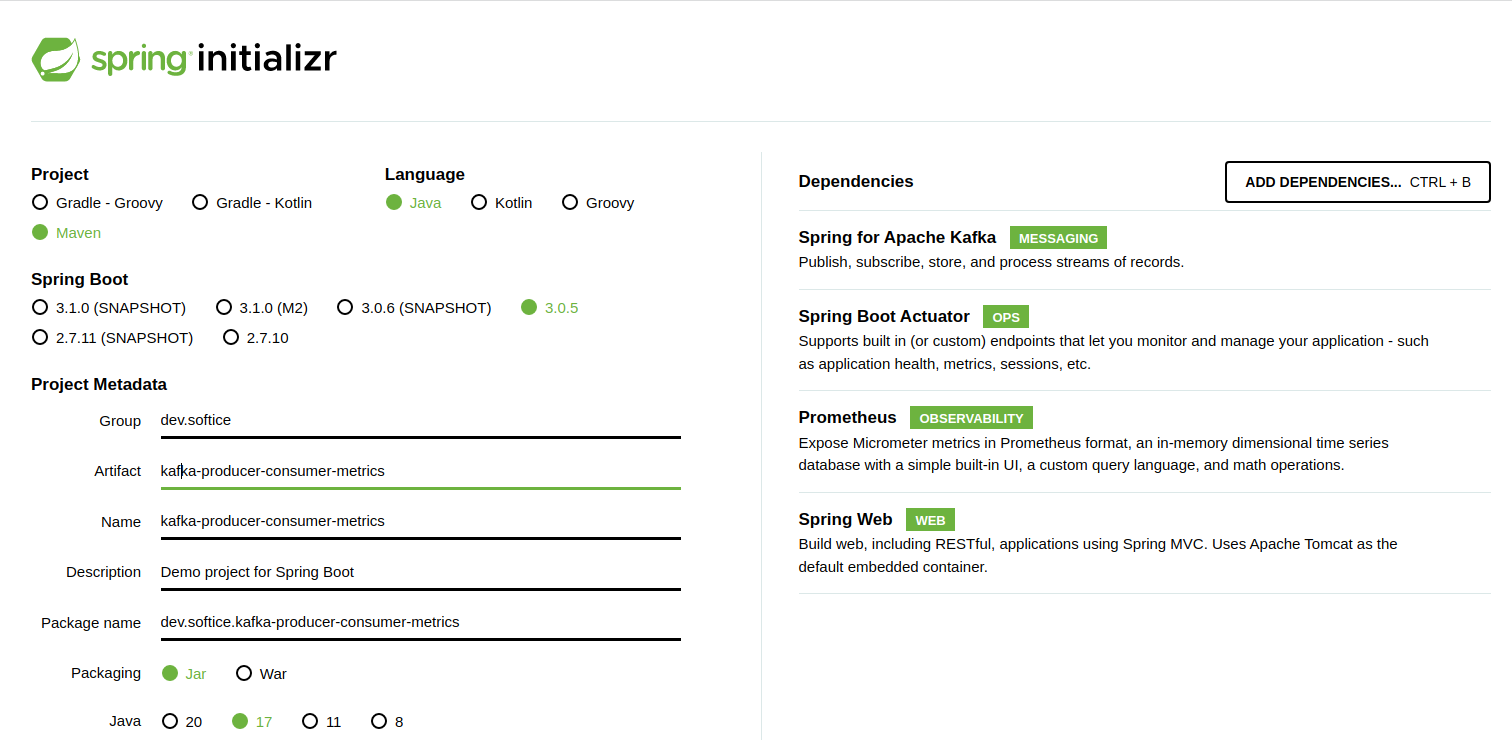
Let’s go to https://start.spring.io/ and create a simple Spring boot project which will publish messages to Apache kafka.

Creating the project

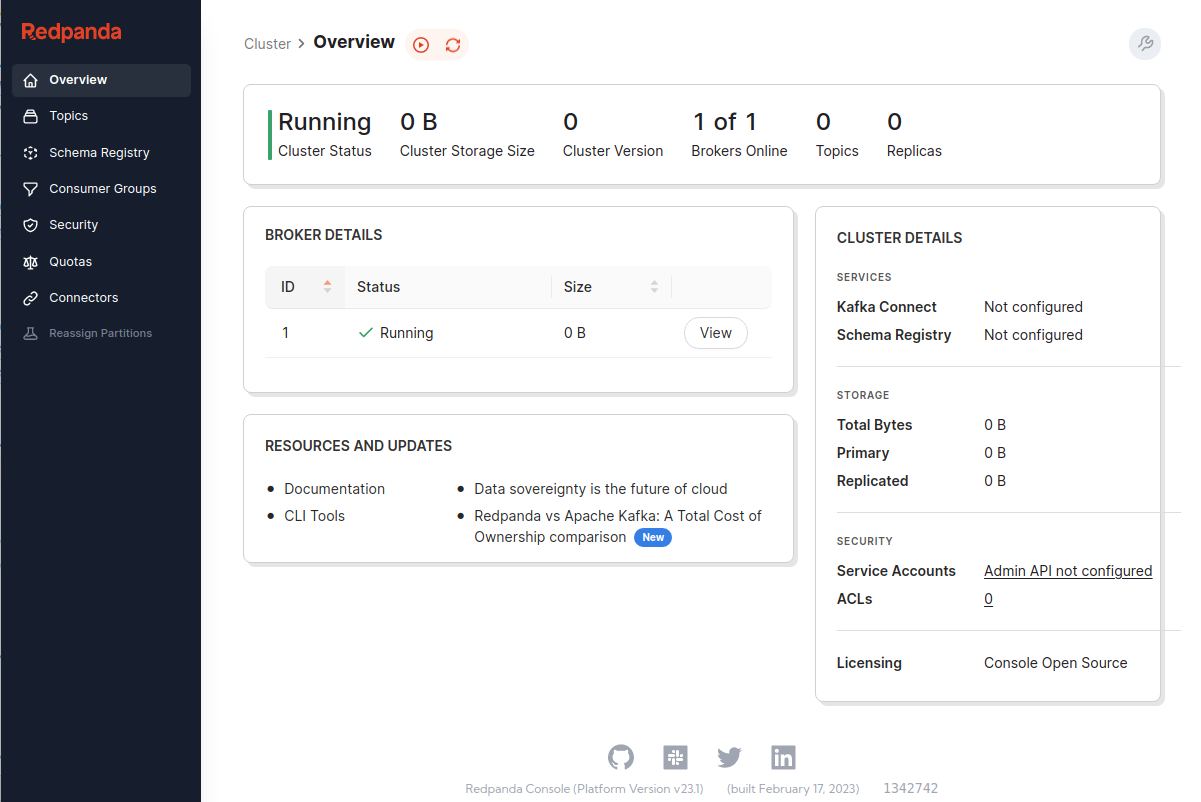
Let’s also create a docker-compose.yaml file, where we’ll declare all the docker containers we’re going to run locally. For now we’ll need Zookeeper, Apache kafka, and Redpanda console (for visualizing what’s inside our kafka).

 1
 2
 3
 4
 5
 6
 7
 8
 9
10
11
12
13
14
15
16
17
18
19
20
21
22
23
24
25
26
27
28
29
30
31
32
33
34
35
36
37
38
39
40
41
42
43
44
version: '3'
services:
  #Zookeeper for Kafka
  zookeeper:
    image: confluentinc/cp-zookeeper:7.3.2
    container_name: zookeeper
    environment:
      ZOOKEEPER_CLIENT_PORT: 2181
      ZOOKEEPER_TICK_TIME: 2000

  #Kafka broker
  broker:
    image: confluentinc/cp-kafka:7.3.2
    container_name: broker
    depends_on:
      - zookeeper
    ports:
      - "9092:9092"
      - "49999:49999"
    environment:
      KAFKA_BROKER_ID: 1
      KAFKA_ZOOKEEPER_CONNECT: zookeeper:2181
      KAFKA_LISTENER_SECURITY_PROTOCOL_MAP: PLAINTEXT:PLAINTEXT,PLAINTEXT_HOST:PLAINTEXT
      KAFKA_INTER_BROKER_LISTENER_NAME: PLAINTEXT
      KAFKA_ADVERTISED_LISTENERS: PLAINTEXT://broker:29092,PLAINTEXT_HOST://localhost:9092
      KAFKA_AUTO_CREATE_TOPICS_ENABLE: "true"
      KAFKA_OFFSETS_TOPIC_REPLICATION_FACTOR: 1
      KAFKA_TRANSACTION_STATE_LOG_MIN_ISR: 1
      KAFKA_TRANSACTION_STATE_LOG_REPLICATION_FACTOR: 1
      KAFKA_GROUP_INITIAL_REBALANCE_DELAY_MS: 100
      KAFKA_JMX_PORT: 49999
      KAFKA_MESSAGE_MAX_BYTES: 10000

  #Redpanda console (kafka visualization tool)
  redpanda-console:
    image: docker.redpanda.com/vectorized/console:v2.2.0
    container_name: redpanda-console
    ports:
      - "7070:8080"
    environment:
      KAFKA_BROKERS: broker:29092
    depends_on:
      - broker
    restart: on-failure

We can start the infrastructure now using the following command:

1
$ docker-compose up

We can check if the Kafka cluster is up & running by checking the following url: http://localhost:7070/overview

Redpanda console

Configuring the application.properties

Now let’s edit our application.properties file so that it points to our kafka cluster, like shown below:

#Kafka properties
spring.kafka.producer.bootstrap-servers=localhost:9092
spring.kafka.producer.acks=all
spring.kafka.producer.key-serializer=org.apache.kafka.common.serialization.StringSerializer
spring.kafka.producer.value-serializer=org.springframework.kafka.support.serializer.JsonSerializer

#Actuator properties
management.endpoints.web.exposure.include=*

spring.jmx.enabled=true

Creating a simple kafka producer

Now let’s try to create our Kafka producer. First we need to think about what kind of messages we’re going to publish to kafka. In our example we’ll use the so-called stock-quotes, which represent a price update for a given public company’s stock. We’ll use a StockQuote record for that:

1
2
3
@Builder
public record StockQuote(String id, String symbol, String exchange, String currency, String tradeValue) {
}

The Kafka publisher itself will look something like this:

 1
 2
 3
 4
 5
 6
 7
 8
 9
10
11
12
13
14
15
@Component
@Slf4j
public class StockQuotePublisher {

    private final KafkaTemplate<String, StockQuote> stockQuotePublisher;

    public StockQuotePublisher(KafkaTemplate<String, StockQuote> stockQuotePublisher) {
        this.stockQuotePublisher = stockQuotePublisher;
    }

    public void publish(StockQuote stockQuote) {
        log.info("Publishing stock quote: {}", stockQuote);
        stockQuotePublisher.send(KafkaTopics.STOCK_QUOTES_TOPIC, stockQuote.id(), stockQuote);
    }
}

Since we want to look at metrics, let also write a generator class which will publish messages quite frequently to kafka, so that we’ll have more data to look at.

 1
 2
 3
 4
 5
 6
 7
 8
 9
10
11
12
13
14
15
16
17
@Component
public class StockQuoteGenerator {

    private static final String[] EXCHANGES = {"NYSE", "NSDQ"};
    private static final String[] STOCK_SYMBOLS = {"DAVA", "AAPL", "NFLX", "META", "GOGL", "TSLA", "AMZN"};

    public StockQuote generate() {
        ThreadLocalRandom random = ThreadLocalRandom.current();
        return StockQuote.builder()
                         .id(UUID.randomUUID().toString())
                         .currency("EUR")
                         .exchange(EXCHANGES[random.nextInt(EXCHANGES.length)])
                         .symbol(STOCK_SYMBOLS[random.nextInt(STOCK_SYMBOLS.length)])
                         .tradeValue(BigDecimal.valueOf(random.nextInt(60, 1000)).toString())
                         .build();
    }
}

Here’s out scheduler:

 1
 2
 3
 4
 5
 6
 7
 8
 9
10
11
12
13
14
15
16
17
@Component
public class StockQuoteScheduler {

    private final StockQuotePublisher quotePublisher;
    private final StockQuoteGenerator stockQuoteGenerator;

    public StockQuoteScheduler(StockQuotePublisher quotePublisher, StockQuoteGenerator stockQuoteGenerator) {
        this.quotePublisher = quotePublisher;
        this.stockQuoteGenerator = stockQuoteGenerator;
    }

    @Scheduled(fixedRate = 500)
    public void tick() {
        StockQuote stockQuote = stockQuoteGenerator.generate();
        quotePublisher.publish(stockQuote);
    }
}

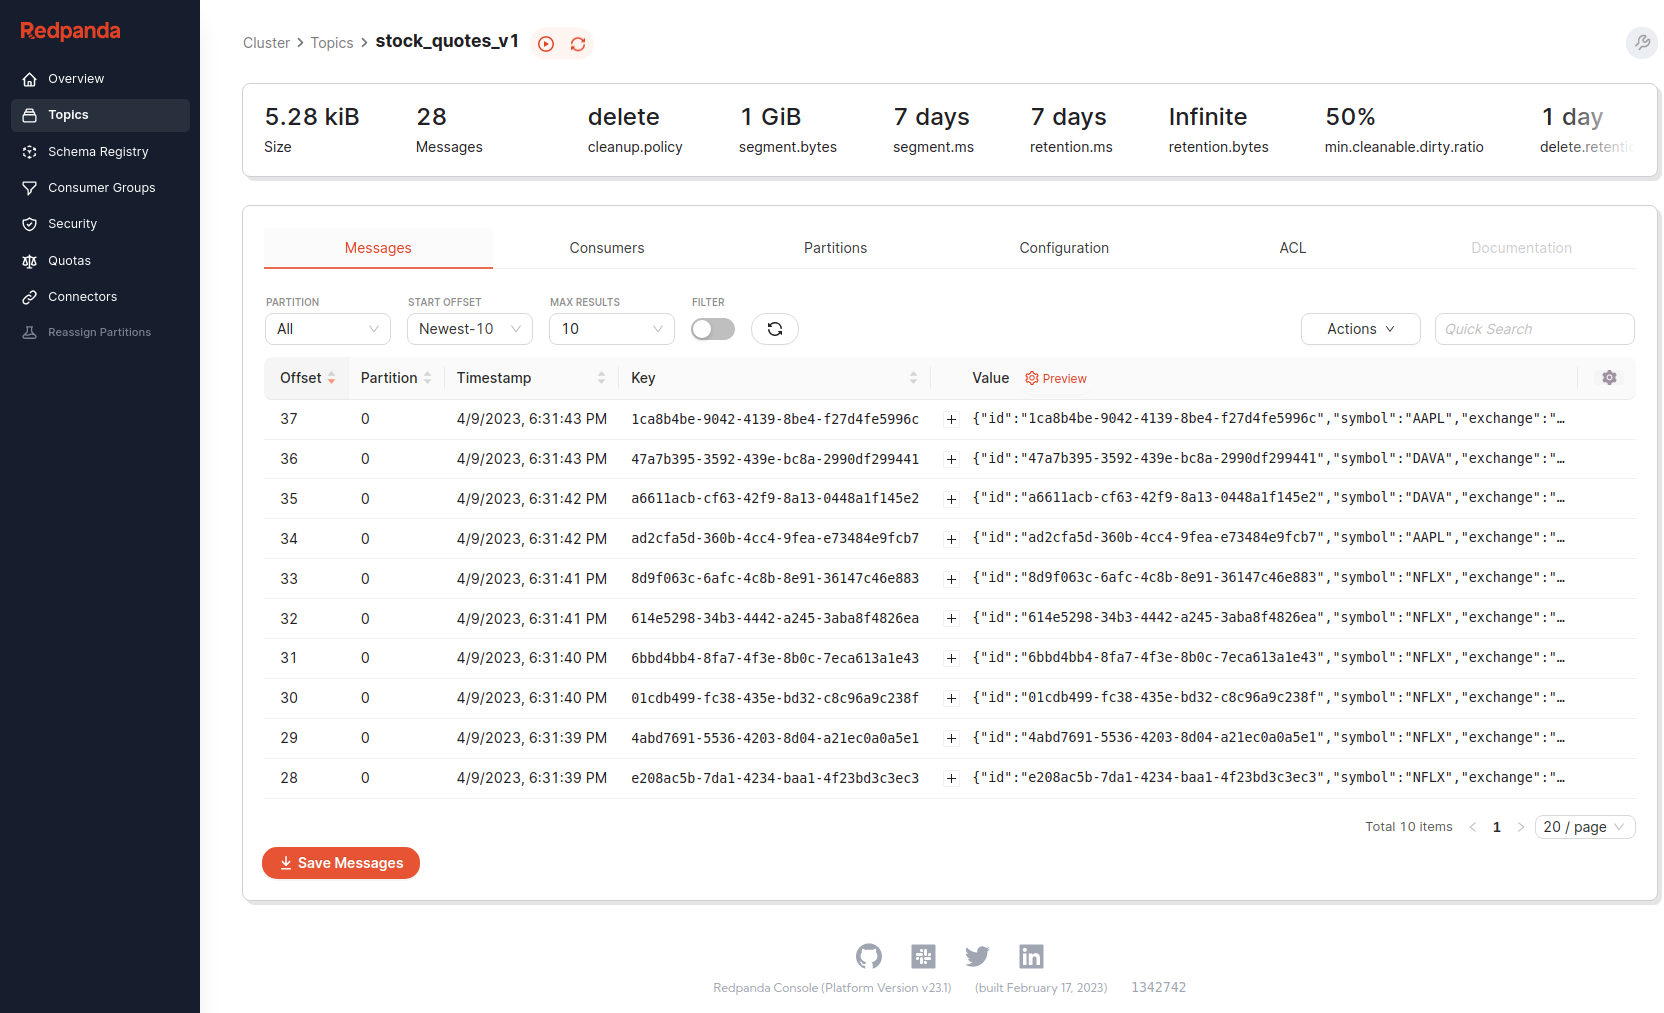
If we’ll run our application, it should start publishing messages to kafka. We can check out the published messages in redpanda console:

Redpanda console - produced messaged

Exposing the metrics to actuator

Now let’s try to expose the Kafka producer metrics to Spring Boot's actuator endpoint, so that we observe what’s the performance of our producer. We’ll modify our kafka java configuration like this:

 1
 2
 3
 4
 5
 6
 7
 8
 9
10
11
12
13
14
15
16
@Configuration(proxyBeanMethods = false)
public class KafkaConfig {

    @Bean
    public ProducerFactory<String, StockQuote> producerFactory(KafkaProperties properties, MeterRegistry meterRegistry) {
        ProducerFactory<String, StockQuote> producerFactory = new DefaultKafkaProducerFactory<>(properties.buildProducerProperties());
        producerFactory.addListener(new MicrometerProducerListener<>(meterRegistry)); //<--- expose metrics to actuator
        return producerFactory;
    }

    @Bean
    public KafkaTemplate<String, StockQuote> kafkaTemplate(ProducerFactory<String, StockQuote> producerFactory) {
        KafkaTemplate<String, StockQuote> kafkaTemplate = new KafkaTemplate<>(producerFactory);
        return new KafkaTemplate<>(producerFactory);
    }
}

Also we’ve configured our spring boot app so that it exposes all actuator endpoints, like this

#Actuator properties
management.endpoints.web.exposure.include=*

If we’ll try to access out actuator metrics endpoint (http://localhost:8080/actuator/metrics), we should see the following:

 1
 2
 3
 4
 5
 6
 7
 8
 9
10
11
12
13
14
15
16
17
18
19
20
21
22
23
24
25
26
27
28
29
30
31
32
33
34
35
36
37
38
39
40
41
42
43
44
45
46
47
48
49
50
51
52
53
54
55
56
57
58
59
60
61
62
63
64
65
66
67
68
69
70
71
72
73
74
75
76
77
78
79
80
81
82
{
"names": [
//...
"kafka.app.info.start.time.ms",
"kafka.producer.batch.size.avg",
"kafka.producer.batch.size.max",
"kafka.producer.batch.split.rate",
"kafka.producer.batch.split.total",
"kafka.producer.buffer.available.bytes",
"kafka.producer.buffer.exhausted.rate",
"kafka.producer.buffer.exhausted.total",
"kafka.producer.buffer.total.bytes",
"kafka.producer.bufferpool.wait.ratio",
"kafka.producer.bufferpool.wait.time.ns.total",
"kafka.producer.bufferpool.wait.time.total",
"kafka.producer.compression.rate.avg",
"kafka.producer.connection.close.rate",
"kafka.producer.connection.close.total",
"kafka.producer.connection.count",
"kafka.producer.connection.creation.rate",
"kafka.producer.connection.creation.total",
"kafka.producer.failed.authentication.rate",
"kafka.producer.failed.authentication.total",
"kafka.producer.failed.reauthentication.rate",
"kafka.producer.failed.reauthentication.total",
"kafka.producer.flush.time.ns.total",
"kafka.producer.incoming.byte.rate",
"kafka.producer.incoming.byte.total",
"kafka.producer.io.ratio",
"kafka.producer.io.time.ns.avg",
"kafka.producer.io.time.ns.total",
"kafka.producer.io.wait.ratio",
"kafka.producer.io.wait.time.ns.avg",
"kafka.producer.io.wait.time.ns.total",
"kafka.producer.io.waittime.total",
"kafka.producer.iotime.total",
"kafka.producer.metadata.age",
"kafka.producer.metadata.wait.time.ns.total",
"kafka.producer.network.io.rate",
"kafka.producer.network.io.total",
"kafka.producer.outgoing.byte.rate",
"kafka.producer.outgoing.byte.total",
"kafka.producer.produce.throttle.time.avg",
"kafka.producer.produce.throttle.time.max",
"kafka.producer.reauthentication.latency.avg",
"kafka.producer.reauthentication.latency.max",
"kafka.producer.record.error.rate",
"kafka.producer.record.error.total",
"kafka.producer.record.queue.time.avg",
"kafka.producer.record.queue.time.max",
"kafka.producer.record.retry.rate",
"kafka.producer.record.retry.total",
"kafka.producer.record.send.rate",
"kafka.producer.record.send.total",
"kafka.producer.record.size.avg",
"kafka.producer.record.size.max",
"kafka.producer.records.per.request.avg",
"kafka.producer.request.latency.avg",
"kafka.producer.request.latency.max",
"kafka.producer.request.rate",
"kafka.producer.request.size.avg",
"kafka.producer.request.size.max",
"kafka.producer.request.total",
"kafka.producer.requests.in.flight",
"kafka.producer.response.rate",
"kafka.producer.response.total",
"kafka.producer.select.rate",
"kafka.producer.select.total",
"kafka.producer.successful.authentication.no.reauth.total",
"kafka.producer.successful.authentication.rate",
"kafka.producer.successful.authentication.total",
"kafka.producer.successful.reauthentication.rate",
"kafka.producer.successful.reauthentication.total",
"kafka.producer.txn.abort.time.ns.total",
"kafka.producer.txn.begin.time.ns.total",
"kafka.producer.txn.commit.time.ns.total",
"kafka.producer.txn.init.time.ns.total",
"kafka.producer.txn.send.offsets.time.ns.total",
"kafka.producer.waiting.threads",
//...
]
}

To access an individual metric, we can access the following endpoint: http://localhost:8080/actuator/{metricName}.

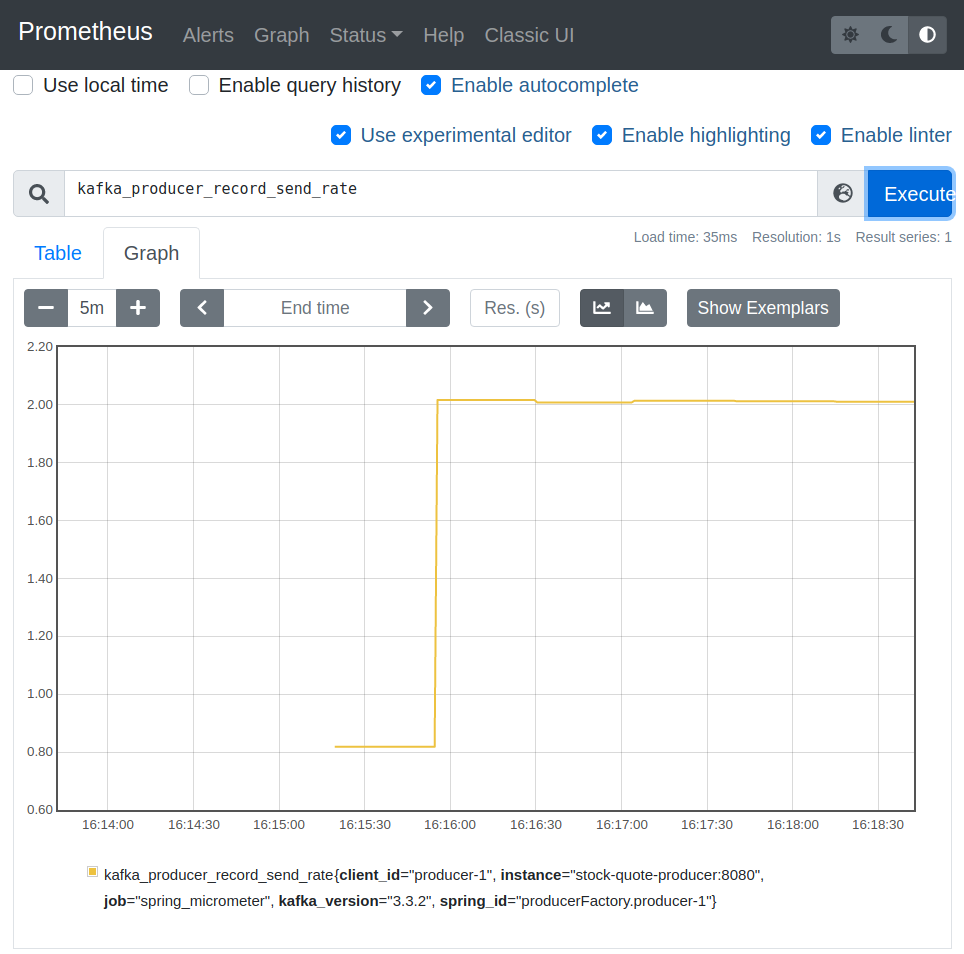
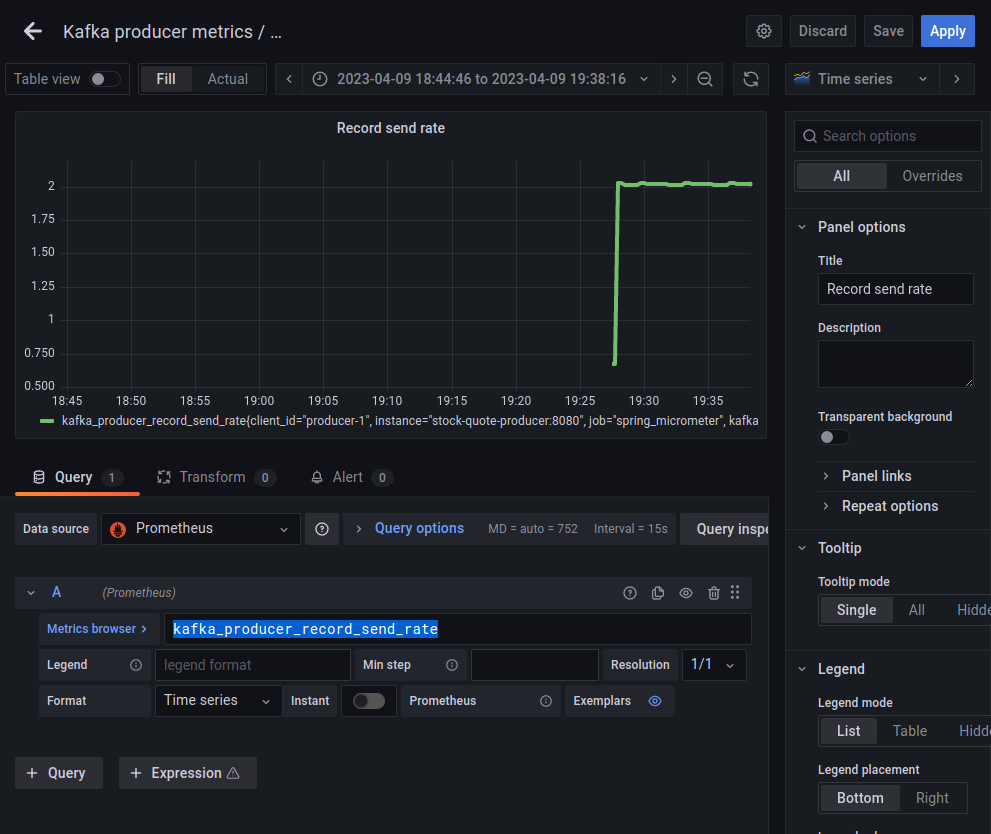
For example, kafka.producer.record.send.rate it’s an interesting one. Since our scheduler is configured like shown below, we expect the producer send rate to be roughly equal to 2.

1
2
3
4
5
6
7
8
@Component
public class StockQuoteScheduler {
    //...
    @Scheduled(fixedRate = 500) //<--- 2 messages per second
    public void tick() {
       //...
    }
}

Let’s check the Actuator metric, by accessing: http://localhost:8080/actuator/kafka.producer.record.send.rate. We should get a response like shown below:

 1
 2
 3
 4
 5
 6
 7
 8
 9
10
11
12
13
14
15
16
17
18
19
20
21
22
23
24
25
26
27
28
29
30
{
  "name": "kafka.producer.record.send.rate",
  "description": "The average number of records sent per second.",
  "measurements": [
    {
      "statistic": "VALUE",
      "value": 2.0084566596194504
    }
  ],
  "availableTags": [
    {
      "tag": "spring.id",
      "values": [
        "producerFactory.producer-1"
      ]
    },
    {
      "tag": "kafka.version",
      "values": [
        "3.3.2"
      ]
    },
    {
      "tag": "client.id",
      "values": [
        "producer-1"
      ]
    }
  ]
}

Exporting the metrics to Prometheus and Grafana

As we remember, when we’ve created the project we’ve added the following maven dependency:

1
2
3
4
5
6
7
8
9
<dependencies>
    <!-- ...   -->
    <dependency>
        <groupId>io.micrometer</groupId>
        <artifactId>micrometer-registry-prometheus</artifactId>
        <scope>runtime</scope>
    </dependency>
    <!-- ...   -->
</dependencies>

What this did is that our Actuator now has a new endpoint called http://localhost:8080/actuator/prometheus.

Basically it provides exactly the same information as http://localhost:8080/actuator/metrics, the difference being that it’s in an Prometheus-specific format.

We can now configure a Prometheus instance to poll this endpoint periodically. The idea is that Prometheus is a time-series database tailored specifically for metrics. Whenever Prometheus will hit the http://localhost:8080/actuator/prometheus, it will store all the metrics information and associate every metric with a timestamp. By doing that, we can observe how a specific metric evolves over time.

Let’s add Prometheus to our docker-compose.yaml file, like shown below:

 1
 2
 3
 4
 5
 6
 7
 8
 9
10
11
12
version: '3'
services:
  #Previously defined containers like zookeeper, kafka & redpanda
  #...
  #Prometheus
  prometheus:
    image: prom/prometheus:v2.28.1
    container_name: prometheus
    ports:
      - "9090:9090"
    volumes:
      - ./prometheus/prometheus.yml:/etc/prometheus/prometheus.yml

The prometheus.yml file from above is a simple configuration file which looks like this:

 1
 2
 3
 4
 5
 6
 7
 8
 9
10
11
12
13
global:
  scrape_interval: 30s

scrape_configs:
  - job_name: 'spring_micrometer'
    metrics_path: '/actuator/prometheus'
    scrape_interval: 35s
    scrape_timeout: 30s
    static_configs:
      - targets: ['stock-quote-producer:8080']
    basic_auth:
      username: 'admin'
      password: 'admin'

What’s worth pointing out is that Prometheus will invoke the http://stock-quote-producer:8080/actuator/prometheus endpoint periodically (every 35 seconds). The request timeout for a single call is 30 seconds.

Now the catch is that since we’ve run Prometheus as a docker container (which is isolated from our local machine), our application should be run also as a docker container, so that Prometheus can call it. At the moment the above prometheus.yml expects our app to be running on http://stock-quote-producer:8080. So we need now to create a docker image out of our spring boot app and use stock-quote-producer as the container name. Let’s do this.

 1
 2
 3
 4
 5
 6
 7
 8
 9
10
11
12
13
14
FROM openjdk:17-alpine
COPY target/kafka-producer-consumer-metrics-0.0.1-SNAPSHOT.jar /evil/kafka-producer-consumer-metrics.jar
RUN addgroup -S -g 2023 evil && \
    adduser -S -g evil -u 2023 evil
RUN mkdir -p /evil/
RUN mkdir -p /evil/logs
RUN chown -R evil:evil /evil
RUN find /evil/ -type f -exec chmod 644 {} \; && chmod 775 /evil/logs
USER evil:evil
EXPOSE 8080
WORKDIR /evil
ENTRYPOINT [ "java",\
"-jar",\
"./kafka-producer-consumer-metrics.jar"]

Nothing fancy so far. We’ve just copied the target/kafka-producer-consumer-metrics-0.0.1-SNAPSHOT.jar file into a directory called evil and we’ve also created a new group called evil, with a user named evil as well.

Now we’ll modify our docker-compose.yaml file once more so that it includes our spring boot application, like this:

 1
 2
 3
 4
 5
 6
 7
 8
 9
10
11
12
13
14
15
16
17
version: '3'
services:
  #Previously defined containers like zookeeper, kafka & redpanda
  #...
  stock-quote-producer:
    build:
      dockerfile: ./infra/docker/Dockerfile
      context: "../../"
    container_name: stock-quote-producer
    ports:
      - "8080:8080"
    environment:
      SPRING_KAFKA_PRODUCER_BOOTSTRAP_SERVERS: broker:29092
    restart: on-failure
    depends_on:
      - broker
      - prometheus

Now if we’ll run the new docker-compose.yaml file, all of our metrics data should be stored in prometheus, and we should be able to check how specific metrics evolve over time. To access the Prometheus dashboard, we just need to access the following endpoint: http://localhost:9090/.

Prometheus dashboard

Now Prometheus is a great tool to store metrics, but it doesn’t have fancy graph-plotting abilities. To fix that we can use Grafana

Configuring Grafana

In order to use Grafana, we’ll need to add yet another docker container to our docker-compose.yaml file, like shown below:

 1
 2
 3
 4
 5
 6
 7
 8
 9
10
11
12
version: '3'
services:
  #Previously defined containers like zookeeper, kafka & redpanda
  #...
  #Grafana dashboard
  grafana:
    image: grafana/grafana:8.0.6
    container_name: grafana
    ports:
      - "3000:3000"
    depends_on:
      - prometheus

The Grafana will be accessible at http://localhost:3000/. The default credentials are admin for the username and admin for the password. 
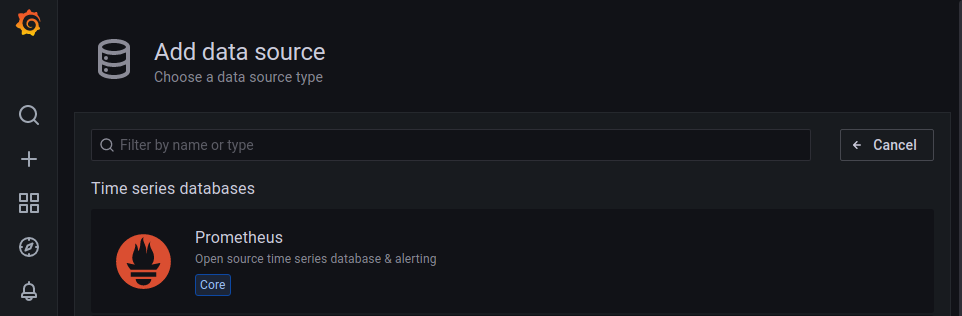
First, we’ll need to configure a Prometheus datasource.

Prometheus datasource

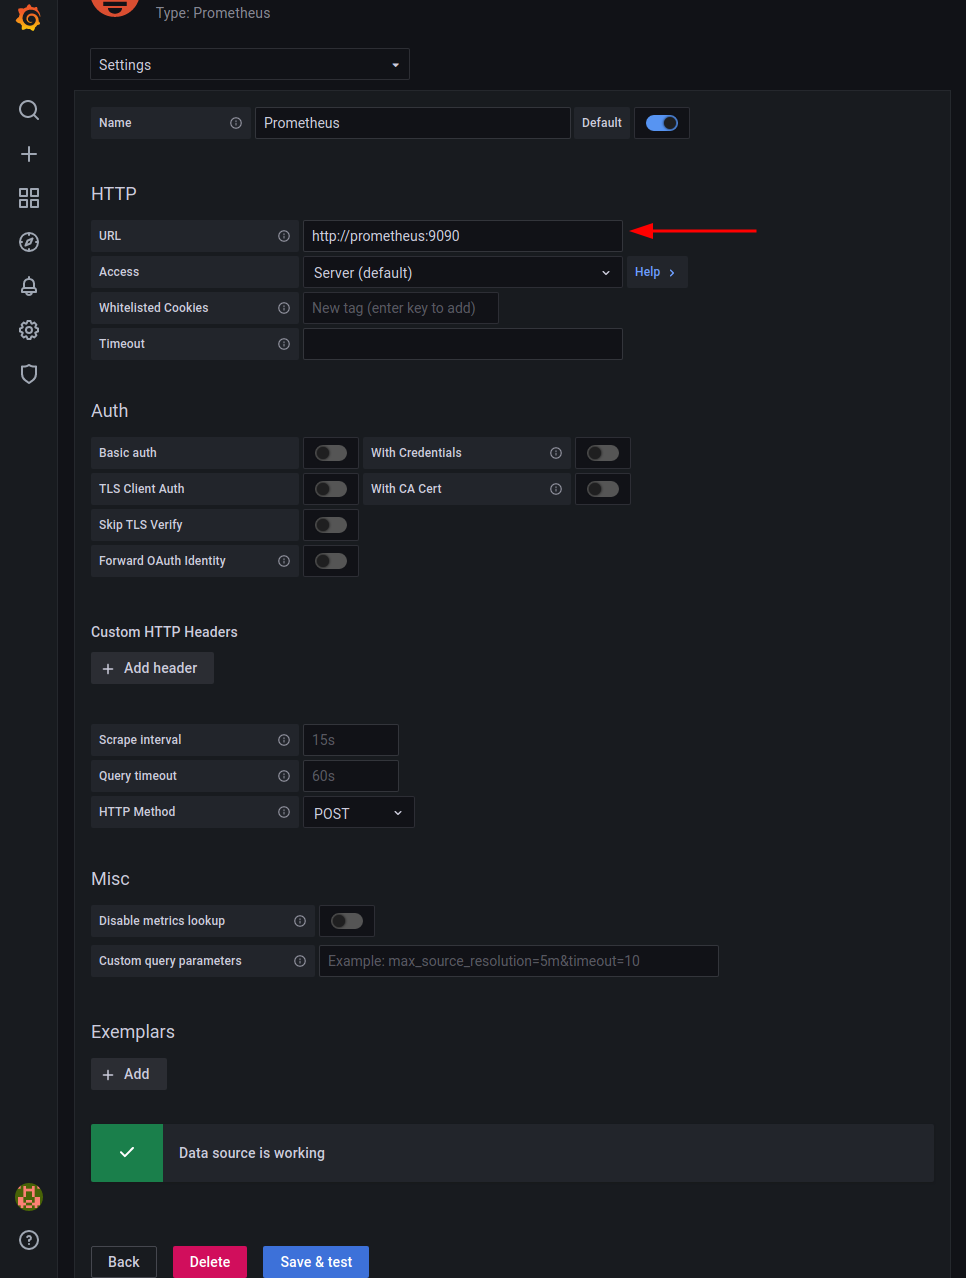
Here we just need to specify the Prometheus's address, which in our case will be http://prometheus:9090/

Prometheus datasource

Nice. Now let’s try to create a basic Grafana dashboard displaying the kafka_producer_record_send_rate metric, like shown below:

Grafana dashboard

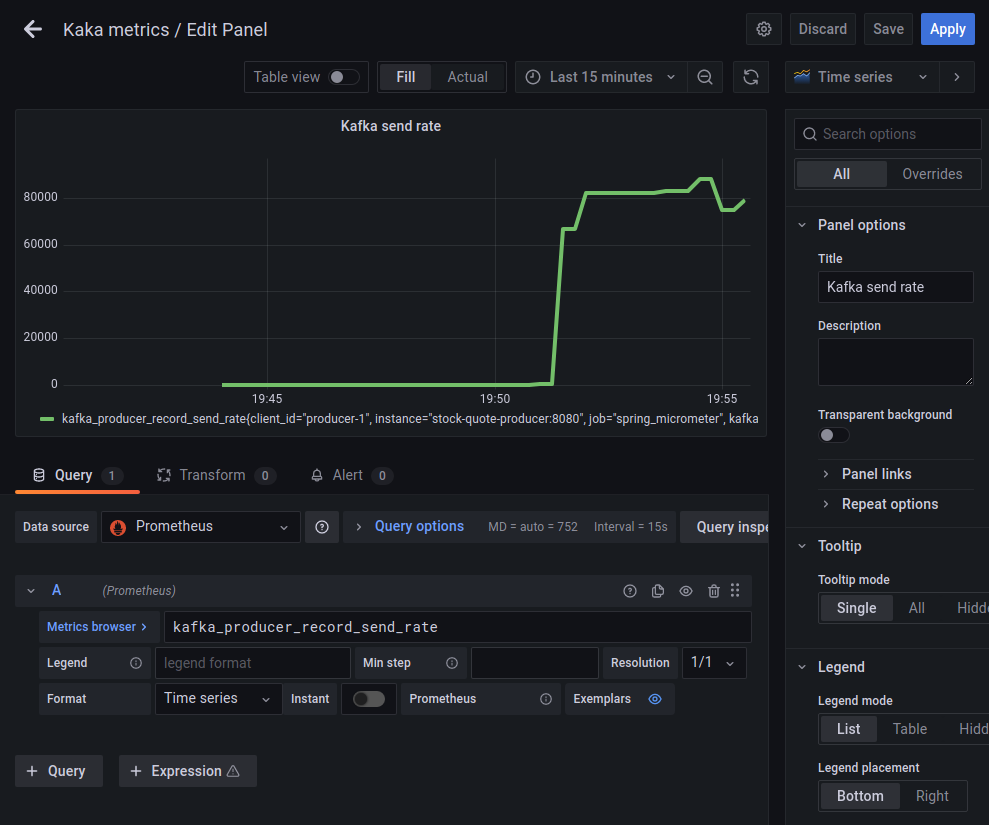
In order to see the maximum throughput of our spring boot app, let’s modify out StockQuoteScheduler like shown below, so that it doesn’t publish only 2 messages per second, but much more.

 1
 2
 3
 4
 5
 6
 7
 8
 9
10
11
12
13
14
15
16
17
@Component
public class StockQuoteScheduler {
    //...

    @PostConstruct
    private void init() {
        new Thread(() -> {
            try {
                while (true) {
                    quotePublisher.publish(stockQuoteGenerator.generate());
                }
            } catch (Exception e) {
                log.error("Kafka producer error", e);
            }
        }).start();
    }
}

Now, if we’ll try to run our app in this configuration, we’ll see that our application produces about 80K messages per second.

Grafana dashboard

Conclusion

In this blog post we saw how to expose Apache Kafka's metrics to actuator, how to then export these metrics to Prometheus and then how to create a Grafana dashboard out of them.

The example code we used in this article can be found on GitHub.